

Cointag - data pipeline for user sentiment analysis on global coin market


#Cointag
Data pipeline for user sentiment analysis on global coin market
#Cointag is a data pipeline to aggregate twitter data relevant to different Cryto Market coin and provides an analytic framework to perform user sentiment analysis on different coin and finding the correlation with the corresponding coin price.
What #Cointag Does
#Cointag allows user to easily check the top trending coin @twitter at different time.
Users can look into the historical data and discover the top trending coin and sentiment of twitter users on that coin at different hours of the day.
Users can also find the time series information about a coin - how many time the coin has been mentioned over time as well as corresponding sentiment.
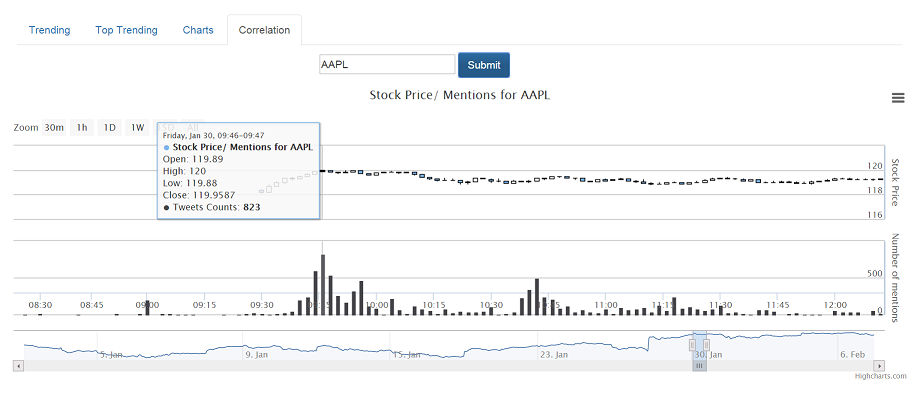
#Cointag also allows user to find the correlation betweent the number of mentions of a coin @twitter and the coin price fluctuation over time.
How #Cointag Works
#Cointag pipeline is based on λ architecture.The pipeline consists of an ingestion layer, batch layer, speed layer, serving layer and frontend. The pipeline diagram is shown below:
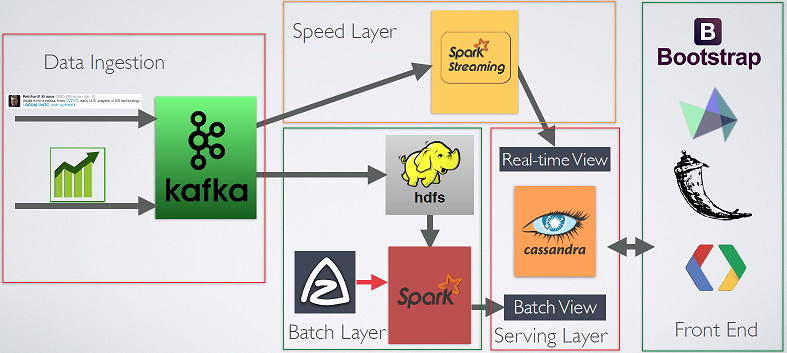
Data Ingestion
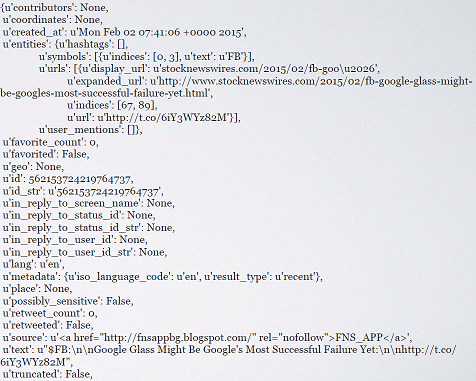
#Cointag works by pulling twitter data and coin market data. #Cointag uses the twitter streaming API. Due to the limitation of this API, the current version is limited to pulling data for about 250 coin including Coinbase, Coinmarketcap and some other popular coin market from these to exchange.
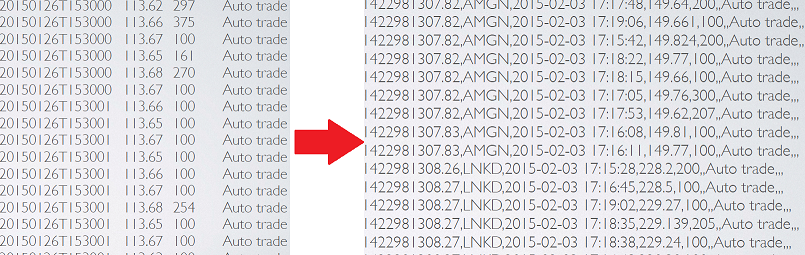
#Cointag fetches coin price information from coinmartketcap.com . The website provides sub-second interval level-1 coin prices delayed by an hour. #Cointag fetches the coin information for each individual coin every 5 seconds. Some pre-processing is done on this coin information - e.g. adding a ticker information and a timestamp.
A multi-consumer multi-topic Kafka instance acts as the data ingestion platform. Both twitter data and coin data are stored in the Kafka first. Python scripts are written to perform these tasks.
Source of Truth
Initially, the source of truth for #Cointag was HDFS drive in the master EC2 node. Kafka consumer programs, written in python, fetch data from Kafka and write it to HDFS. Later, the source of truth was moved to Amazon S3 drives due to the ease of use.
Batch Layer
The choice of tool for batch layer in #Cointag is Spark. Codes are written in Scala. Several batch layer jobs are running periodically throughout the day, where the batch layer jobs are collecting raw data from S3 disk and performing necessary tasks and saving the results in the Serving layer. Azkaban is the tool of choice in #Cointag to perform scheduling of different batch jobs. The reason for choosing Azkaban over crontab was the nice visual user interface, the ease of parallelizing of different tasks in the flow as well as its ability to restart a program in case of failure - and of course the fact that its called Azkaban!
Several taks are performed by the batch layer:
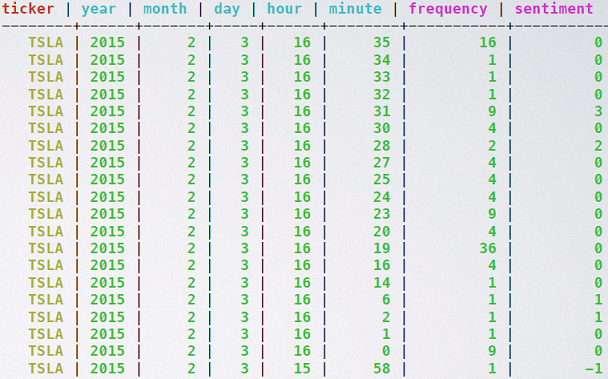
- number of mentions of a coin over different time granularity - minute, hour, day, year etc.
- users' sentiment of the coin over different time granularity
- top trending coin at different time granularity
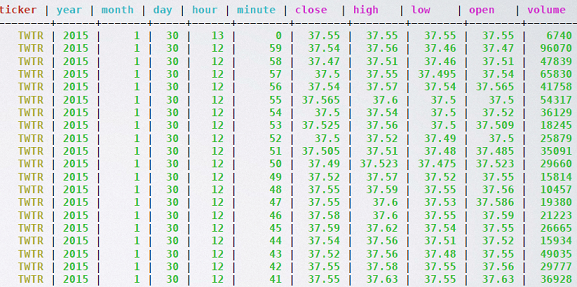
- computing the high, low, open, close and volume data of different coin at different time granularity.
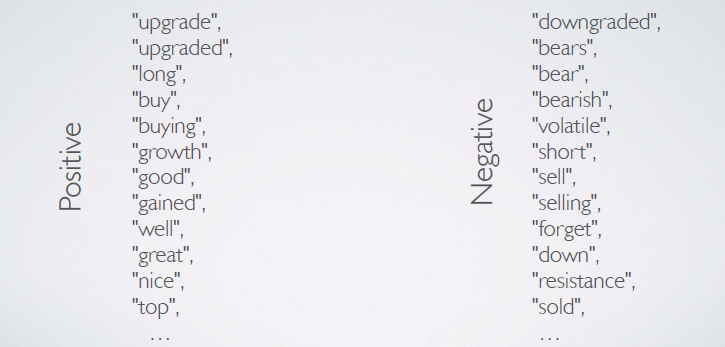
Sentiment Analysis
#Cointag also performs a very simple sentiment analysis over different trending coin. While the main motivation behind creating #Cointag was to create the underlying data pipeline that will enable the end users - data scientist, analyst to perform advanced algorithmic analysis to find the sentimets, I also felt it would be interesting to showcase the ability of this platform by showing a simple sentiment analysis. For this task, #Cointag looks for keywords in each tweets and provides a score of +1 for every positive word it encounters and a -1 for every negative word. The overall sentiment of that tweet then is the sum of all the score of all the words in the tweet.
Speed Layer
Speed layer in #Cointag performs multiple operations. The tool of choice for speed layer is Spark Streaming. Codes are written in scala.
Incremental algorithm to supplement batch layer
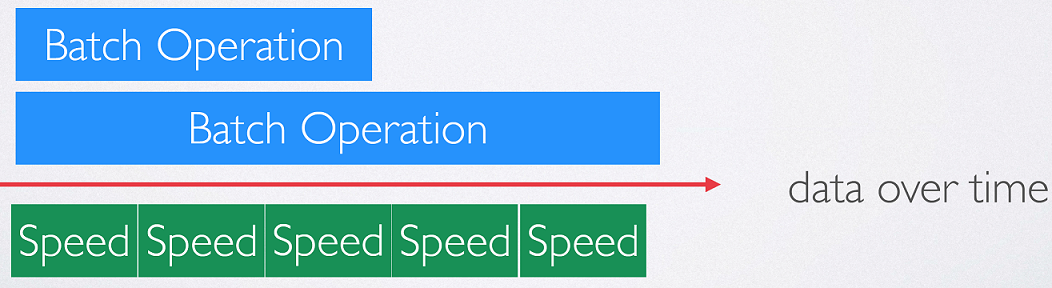
One of the motivation behind having a speed layer in lambda architecture is to supplement the batch layer. The batch layer implements re-computation algorithm that works on the entire sets of raw data and compute the necessary results. Since batch layer is working on the entire raw data set, it is generally time intensive and takes long time to process the entire sets of data. In such cases, speed layer works on the most recent data and provide real time result for these data. While the algorithm in batch layer was re-computation algorithm, the algorithm in speed layer is incremental in nature.
In #Cointag, one of the job of the speed layer is to find the number of mentions of a coin at different granularity. The same operation is also performed in batch layer. In speed layer in spark streaming, the data work on a window of data and make use of the 'updateStateByKey' reduce operation in Spark Streaming. Here, the key is ticker and minute level time. Whenever, the streaming job encounter a particular ticker at a particular time, it search for existing key. If found, it updates that key; if not found, it creates a new key.
Speed layer only operation
Speed layer also calculates the top trending coin over the last 10 minutes - this is a dashboard only operation that is being updated every 5 seconds. The spark streaming reduce operation 'reduceByKeyAndWindow' is specifally suitable for this task.
Serving Layer
The choice of database for serving layer in #Cointag is Cassandra. #Cointag deals with a lot of time series data. Time series data operation is an excellent use case for Cassandra. An excellent article on the use of time series data for Cassandra can be found in planetcassandra.org/getting-started-with-ti... Data from batch layer and speed layer are saved in Cassandra. We can refer to these tables as batch view and real-time view.
#Cointag saves data in multiple de-normalized tables. For efficient read and write operation for both Spark and Spark Streaming to Cassandra connector, as well as for Cassandra to Frontend, the scheme design is very important. The schema for each table has been chosen carefully to make these operation efficient and simple. The schemas are described below:
- Twitter Time Series for Tab 3 and 4
- partitioned by ticker symbol
- clustering order by (year, month, day, hour, minute) 2.Top Trending coin for Tab 2
- partitioned by (year, month, day, hour)
- clustering order by number of mentions
- coin Time Series for Tab 4
- partitioned by ticker symbol
- clustering order by (year, month, day, hour, minute)
The schema design for the rolling count dashboard in Tab 1 to represent the top trending coin in the last 10 minutes was quite tricky. Cassandra is generally a good choice for creating a rolling count dashboard due to its support for TTL (time to live) for each entry. Unfortunately, support for TTL is not available in the current Spark/Spark Streaming to Cassandra connector. As a result I need to improvise. While writing the top trending tickers to cassandra, I added a timestamp to each entry. The Cassandra table was partitioned by ranking and clustering ordered by the time stamp. In the dashboard, the query was to select the top five coin by the ranking id and ordered descendingly by the timestamp. This gives me the latest entries from the table.
Front End
The front end of the project is running on Flask server. The charts were created using HighStock and Google graphs. Bootstrap was the choice for rending CSS.